
112 Health Markers
Build strength and muscle
€ 349
Performance diagnostics in Vienna — know your numbers.
Starting at €299
300+ markers across 7+ tests
15–25min Same-day results
Find a location in Vienna
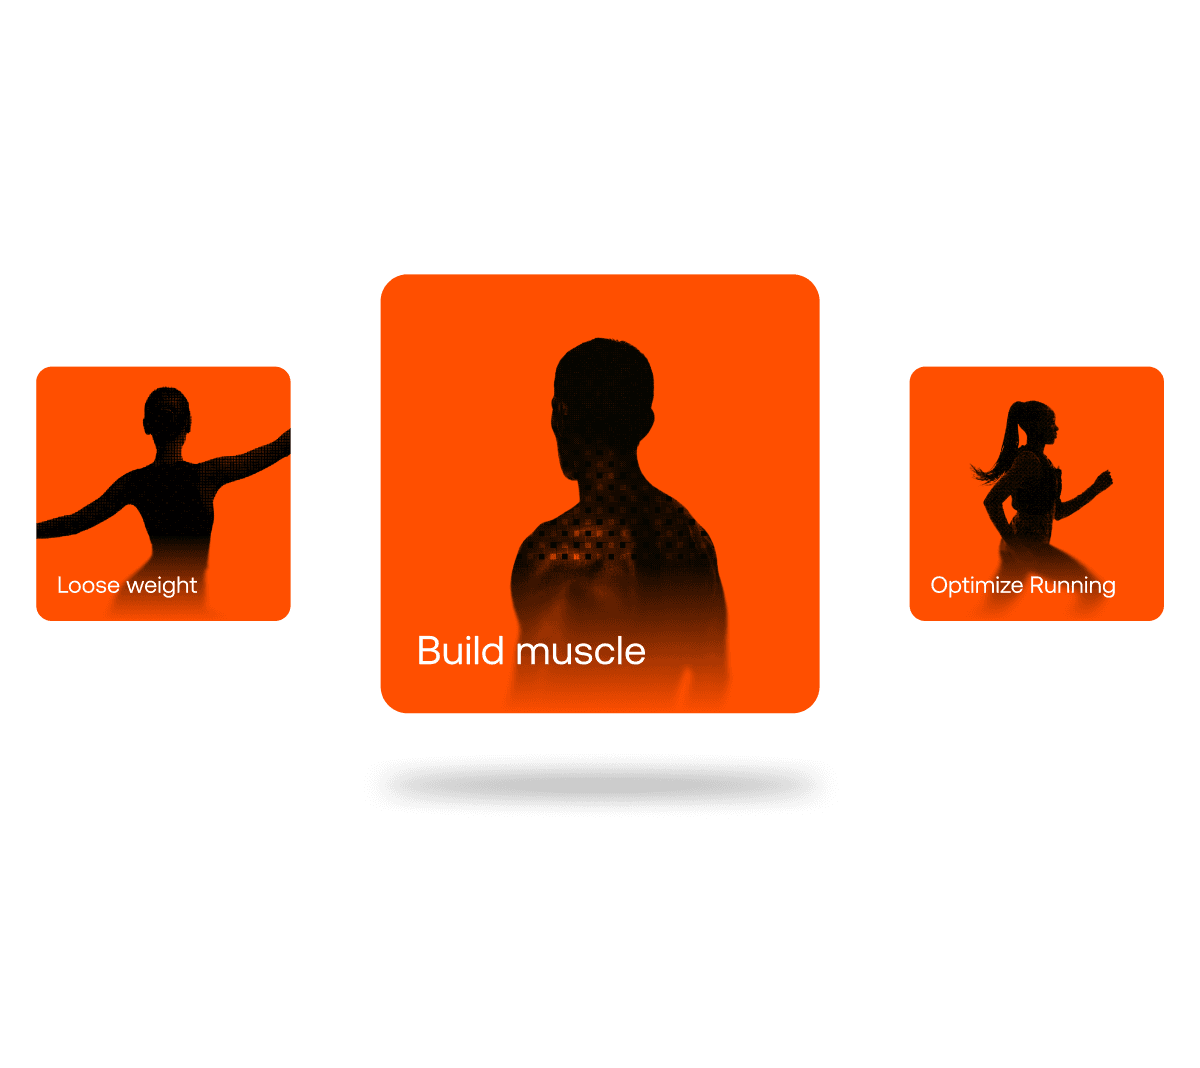
4 different paths
Choose your goal
Across germany, austria and switzerland
Get tested at a location near you
Fully anonymous
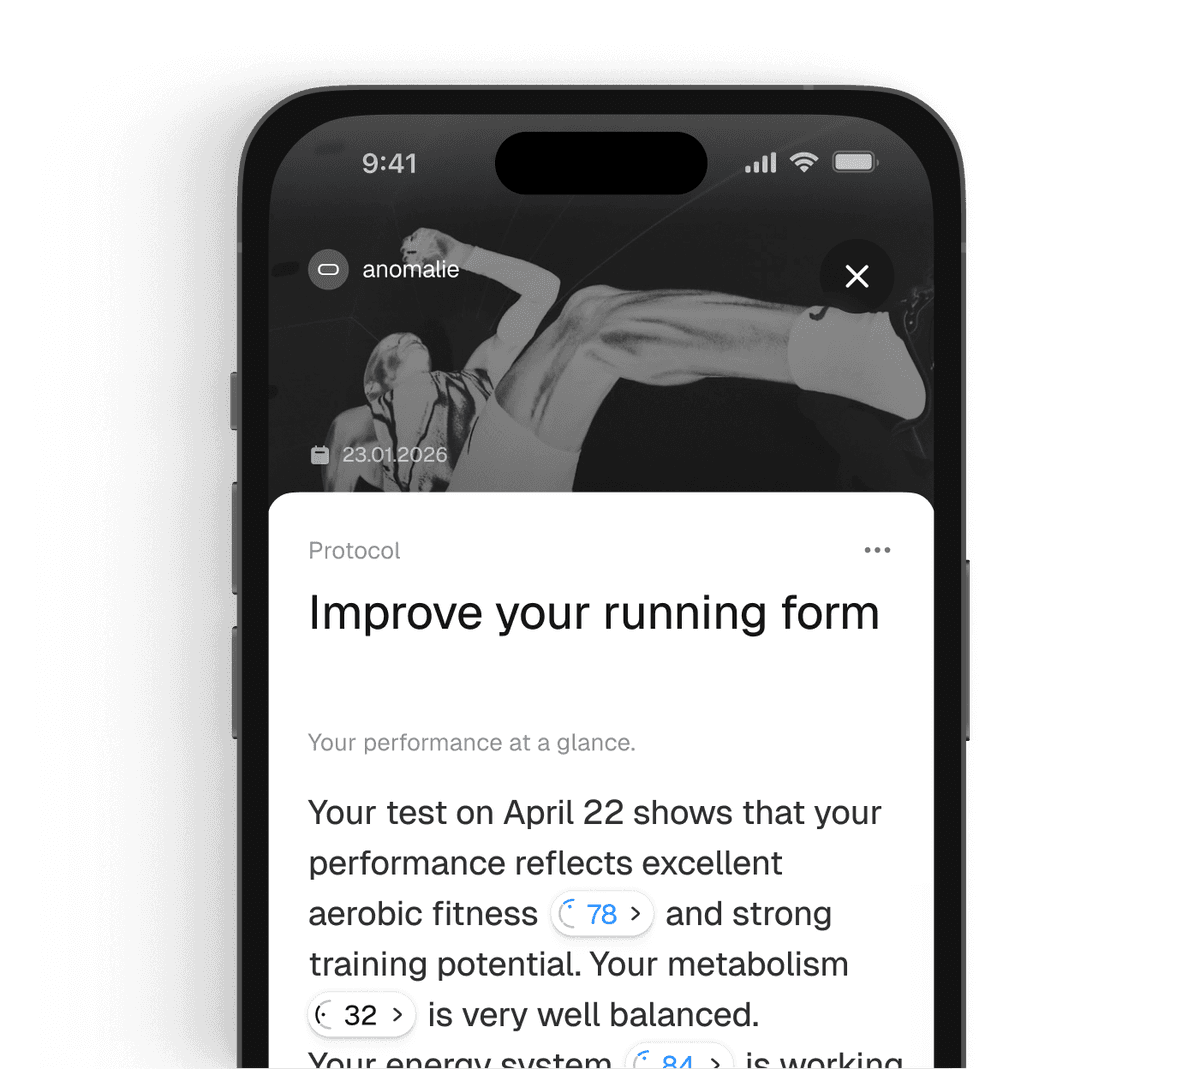
Clear results in the anomalie app
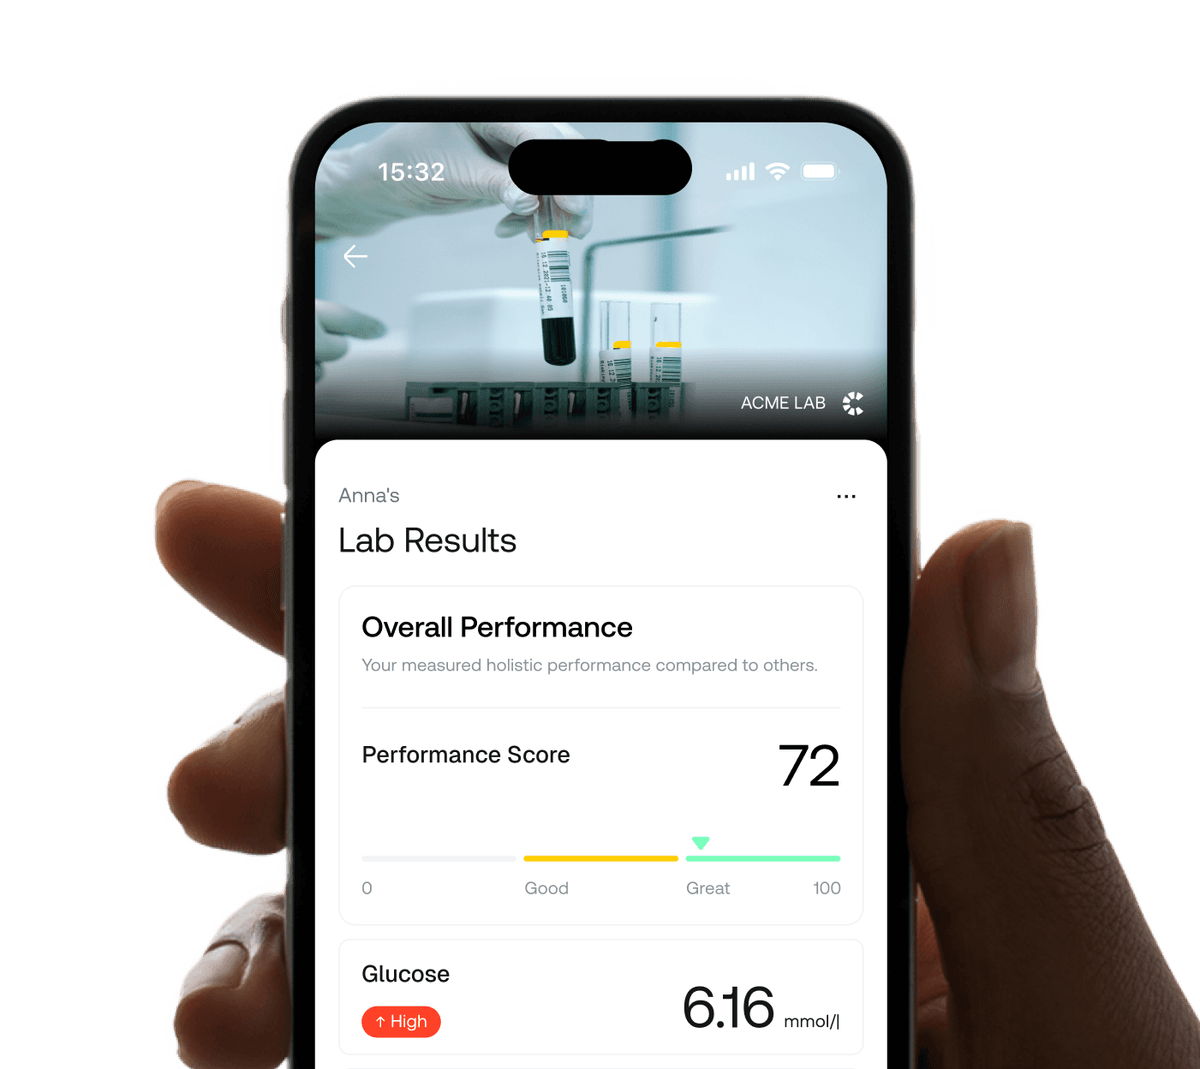
Easy to understand
Action plan to reach your target
Our Marketplace
Recommended products and services
Based on your goal, we select the right combination of tests and you will get a personalized action plan.
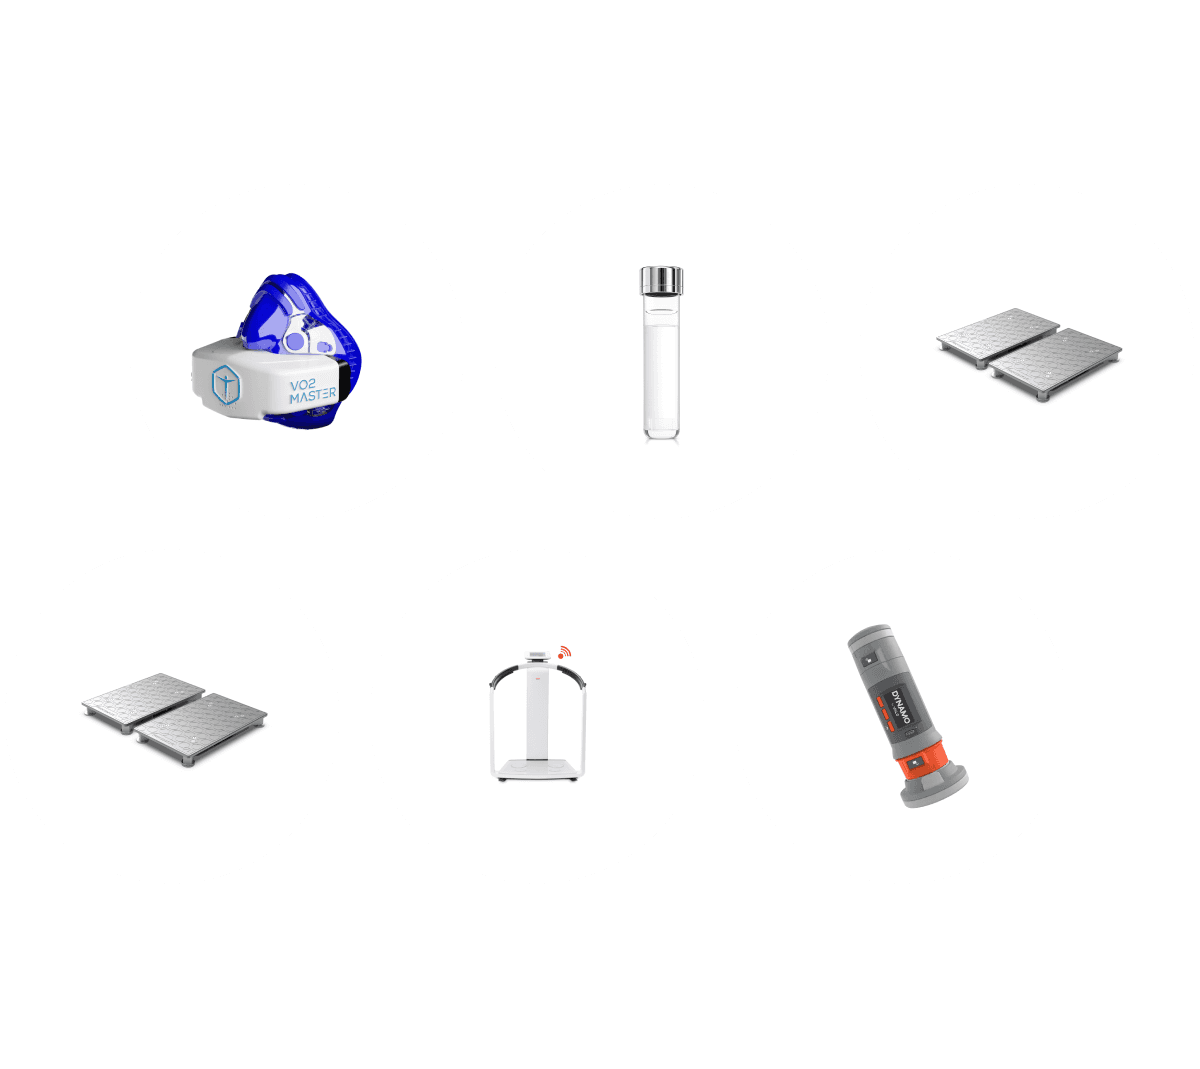
Tests in Vienna
All tests available in Vienna — performed professionally with medical-grade equipment.
Included in
Bio-impedance analysis measures body composition with clinical precision — fat mass, muscle mass, total body water and more. The result is a detailed snapshot of your physique that goes far beyond scale weight and gives you the foundation for targeted protocols.
Health Markers
Total and segmental fat mass as a percentage of body weight
Total and segmental muscle mass — arms, legs, trunk
Intra- and extracellular fluid distribution
Metabolically active fat surrounding internal organs
Cell membrane integrity marker — indicator of cellular health and training status
Estimated daily caloric requirement at rest
Included in
Grip strength is one of the most validated biomarkers in health science — it correlates with all-cause mortality, cardiovascular risk, bone density and functional independence. Using the VALD DynaMo dynamometer we measure peak isometric force in both hands, providing a precise baseline for strength programming and a longitudinal health marker.
Health Markers
Maximum isometric grip strength of the non-dominant hand
Maximum isometric grip strength of the dominant hand
Left-right difference — asymmetries above 10% may indicate imbalance or injury risk
Grip force normalised to body weight — enables comparison across populations and over time
Included in
Force plate testing with VALD ForceDecks quantifies how you generate and manage force during jumps, squats and landing tasks. We measure peak force, rate of force development, jump height and landing symmetry — giving you a precise picture of neuromuscular performance, power output and injury risk that no other test can provide.
Health Markers
Vertical jump height from a standing start — a gold-standard measure of lower-body power
Maximum ground reaction force during the concentric phase — raw force production capacity
How quickly you generate force — critical for explosive movements and sprint performance
Left-right difference in landing impact — asymmetries above 10–15% flag injury risk
Deceleration capacity during the dip phase — indicates neuromuscular control and readiness
Power output normalised to body weight — the most transferable performance metric across sports
Included in
A comprehensive blood panel is the most information-dense diagnostic available. We partner with SYNLAB to analyse a curated set of markers covering iron status, inflammation, metabolic health, thyroid function, lipids and key micronutrients — the markers that most directly impact athletic performance, recovery and long-term health.
Health Markers
Iron storage marker — low ferritin impairs oxygen transport and endurance performance
High-sensitivity C-reactive protein — systemic inflammation marker linked to overtraining and cardiovascular risk
Thyroid panel — regulates metabolism, energy availability and recovery capacity
3-month average blood glucose — gold standard for metabolic health and insulin sensitivity
Critical for bone health, immune function and muscle performance — chronically low in Northern Europe
Lipid panel — cardiovascular risk stratification and metabolic health assessment
Red and white blood cell profile — screens for anemia, infection and general health status
Essential for muscle contraction, nerve function and energy metabolism — depleted by intense training
Included in
Resting blood pressure is the most fundamental cardiovascular screening parameter. Elevated blood pressure is the leading modifiable risk factor for heart disease and stroke — yet frequently undiagnosed in younger, active populations. We use an automated, validated Riester device for clinical-grade measurement in a controlled setting.
Health Markers
Pressure during heart contraction — optimal <120, elevated 120–129, hypertensive ≥130
Pressure between heartbeats — optimal <80, elevated 80–89, hypertensive ≥90
Difference between systolic and diastolic — reflects arterial stiffness and stroke volume
Heart rate at rest — lower values typically indicate better cardiovascular fitness
Included in
A fingerprick glucose measurement provides an immediate snapshot of your current blood sugar level. Combined with optional continuous glucose monitoring (CGM) via the Abbott Libre 2, we can track your glucose response to meals, training and sleep over 14 days — the most actionable metabolic data you can get outside a lab.
Health Markers
Blood sugar after fasting — optimal 70–99, pre-diabetic 100–125, diabetic ≥126
Blood sugar behaviour after meals — spikes above 140 mg/dL indicate impaired glucose tolerance
CGM metric: percentage of time glucose stays in optimal 70–140 mg/dL range over 14 days
Coefficient of variation — lower variability indicates better metabolic flexibility and insulin sensitivity
Included in
A multi-marker saliva panel captures key hormonal and metabolic biomarkers non-invasively. Saliva sampling reflects the bioavailable (free) fraction of hormones like cortisol, testosterone and DHEA — making it uniquely suited for tracking stress response, recovery status and hormonal balance in athletes.
Health Markers
Primary stress hormone — reflects HPA axis activation, circadian rhythm and recovery capacity
Key anabolic hormone — bioavailable fraction indicating muscle-building and recovery potential
Adrenal precursor hormone — counterbalances cortisol and supports immune function
Catabolic-to-anabolic ratio — a validated proxy for overtraining risk and recovery status
Mucosal immune marker — drops with chronic stress and overtraining, indicating immune suppression
Included in
Spiroergometry (CPET) is the gold standard for assessing cardiovascular and metabolic performance. We analyse your oxygen uptake, CO2 output and ventilatory thresholds to define exact training zones and a complete picture of your aerobic capacity.
Health Markers
Maximum oxygen uptake — the definitive measure of aerobic capacity
First ventilatory threshold, upper boundary of fat-burning zone
Second ventilatory threshold, onset of anaerobic metabolism
Ratio of CO2 produced to O2 consumed — indicates substrate utilisation
Precise HR zones derived from ventilatory data, not estimations
Threshold intensity in sport-specific units for direct training application
Included in
Optical gait analysis captures ground contact patterns, cadence, stride symmetry and pressure distribution in real time. Using the OptoGait system integrated with a treadmill, we identify asymmetries, inefficiencies and injury-risk patterns in your running or walking gait — data that directly informs technique coaching, rehab decisions and shoe selection.
Health Markers
Duration each foot spends on the ground per stride — shorter is generally more efficient
Left-right balance — asymmetries above 3% may indicate compensatory patterns or injury risk
Step frequency — a key efficiency variable tied to running economy and impact loading
Airborne phase duration — relates to vertical oscillation and running power
Heel-midfoot-forefoot pressure mapping — identifies strike pattern and loading characteristics
Included in
Sweat composition varies dramatically between individuals — sodium losses can range from 200 to 2,000+ mg per litre. The Nix Hydration Biosensor measures your real-time sweat rate and electrolyte concentration during exercise, giving you a personalised hydration and fuelling strategy that eliminates guesswork.
Health Markers
Total fluid loss per hour — the foundation for calculating personal hydration needs during exercise
Sodium concentration in sweat — determines electrolyte replacement strategy and cramping risk
Absolute sodium loss combining sweat rate and concentration — drives race-day supplementation planning
Personalised drinking strategy in ml per 15-minute intervals based on measured losses

"What really stands out at anomalie is that they test way more than just blood — and the action plan is actually specific to me."

Vera Birgel
Lab User
anomalie labs
A standard GP checkup covers 12–18 markers. It tells you if something is already broken. anomalie Labs runs up to 7 different test types — chosen for how you train, work, and live — and tells you what's coming before it becomes a problem.
| Blood draw | anomalie labs | Longevity clinic | |
|---|---|---|---|
| Price | € 0-50 (insured) | € 299-749 | € 1.500–15.000 |
| Time | 40-90 min | 15-25 min | 4-6 hours |
| Booking & Wait | 2-6 weeks wait | Book online | Appointment only |
| Test types | 1 (blood only) | 5-10 | 7+ |
| Diagnosis by a real doctor | |||
| Medical-grade devices | |||
| Personalized Supplementation | |||
| Actionable results in the app | |||
| Digital same day Results | |||
| Data owned by you | |||
| On going guidance | |||
| Connects your wearables | |||
| Discover products curated for you | |||
| Available across Germany, Austria & Switzerland |
No more wait times for your health
A longevity clinic takes 5 hours because tests run sequentially, in a clinical setting, with waiting rooms and administrative overhead built for a different era.
Why it's fast
We don't run 25 tests. We run the 7 that matter for your use-case. No filler. No time wasted on markers that don't apply to you.

Selected based on your intake data
7 tests perfectly optimized
Medical-grade devices, zero manual processing
Why it's thorough
300+ markers across 7 test types. A standard GP covers 18. Test what you really need, in a fraction of the time, at a fraction of the cost.

Blood, VO2max, body composition, lactate
Cardiovascular, metabolic, functional movement
Same devices used in elite sports medicine
Why the output is better
No waiting two weeks for a PDF you can't read. Your results are in the app before you leave — explained in plain language, with a prioritised action list.

Most results within the session
Every marker explained in context
Clear next steps, not raw numbers
Why it's fast
We don't run 25 tests. We run the 7 that matter for your use-case. No filler. No time wasted on markers that don't apply to you.
Selected based on your intake data
7 tests perfectly optimized
Medical-grade devices, zero manual processing
Why it's thorough
300+ markers across 7 test types. A standard GP covers 18. Test what you really need, in a fraction of the time, at a fraction of the cost.
Blood, VO2max, body composition, lactate
Cardiovascular, metabolic, functional movement
Same devices used in elite sports medicine
Why the output is better
No waiting two weeks for a PDF you can't read. Your results are in the app before you leave — explained in plain language, with a prioritised action list.
Most results within the session
Every marker explained in context
Clear next steps, not raw numbers
anomalie labs
Find an anomalie Labs near you — we operate across Germany, Austria, and Switzerland.
Be the first to know about product launches and updates from anomalie.
By signing up, you agree to our privacy policy.


